Black and Latino Americans, We Have A Voter Turnout Problem
The 2024 Presidential Election Turnout
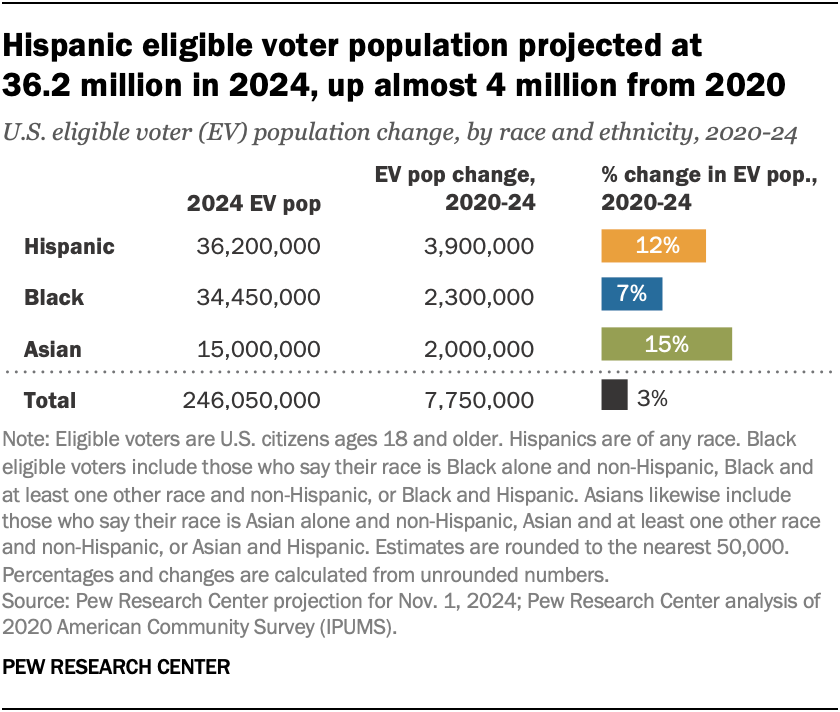
The 2024 Election was hotly contested and as a result, nearly 73.6% (or roughly, 174 million people) of voting age citizens registered to vote. Of that number, 65.3% (roughly 154 million people) voted in that election. These numbers come from the 2024 Current Population Survey (CPS) Voting and Registration Supplement and released by the U.S. Census Bureau. With the data we have for 2024, what will it show when we compare the Black and Latino voters who registered and actually voted?
All Men (of all races) voted at 63.7% | All Women (of all races) voted at 66.9%
2024 Black American Voters
Black voters registered – 70.1%
Black voters not registered – 11.6%
Black voters who voted – 59.6%
Black voters who didn’t vote – 22.7%
Black voters who didn’t respond to voting: 17.7%
Total Reported Registered: 64.8%
Total Reported Voted: 55.1%
2024 Latino American Voters
Latino voters registered – 61.5%
Latino voters not registered – 20.7%
Latino voters who voted – 50.6%
Latino voters who didn’t vote – 32.4%
Latino voters who didn’t respond to voting: 17.0%
Total Reported Registered: 42.8%
Total Reported Voted: 35.2%
Despite the reported numbers of Black (64.8%) and Latino (42.8%) registered voters, the total who actually voted from those numbers were much lower. Now, let’s compare to the 2020 election numbers and see the difference in that particular election between Black and Latino groups.
2020 Black American Voters
Black voters registered – 69.0%
Black voters not registered – 10.5%
Black voters who voted – 62.6%
Black voters who didn’t vote – 17.4%
Black voters who didn’t respond to voting: 20.0%
Total Reported Registered: 64.7%
Total Reported Voted: 58.7%
2020 Latino American Voters
Latino voters registered – 61.1%
Latino voters not registered – 19.2%
Latino voters who voted – 53.7%
Latino voters who didn’t vote – 27.2%
Latino voters who didn’t respond to voting: 19.0%
Total Reported Registered: 44.1%
Total Reported Voted: 38.8%
 
															 
															- In the U.S., young Latinos of both genders experienced the highest drop in youth turn out from 2020 – 2024.
- In Arizona, 47% of the registered 18-29 year old voters turned out versus 51% in 2020, a 4% decrease.
There’s been a drop in voting turnout between 2020 and 2024 in the Black and Latino registered voting block despite having increased registered voters within those four years.
According to Pew Research, the 2024 eligible voter population for Latinos/Hispanics was 36,200,000 which was increased by 3,900,000 since 2020. That’s a 12% change. The 2024 Black eligible voter demographic was 34,450,000 which was an increase of 2,300,000 – a 7% change. Yet, despite the eligibility and the registered voting numbers, fewer voted in 2024 than they did in 2020.
Whatever outreach has happened in the past isn’t working and new strategies need to be created to uplift voter engagement and create interest in voting in Black and Latino communities.
Tomorrow We Vote is working on new methods through digital means to help close these gaps in Arizona. To help support, please become a monthly supporter so we can continue our work.


